Introduction
As database administrators (DBAs), understanding the inner workings of MySQL is crucial for optimizing performance, troubleshooting issues, and ensuring data integrity. This comprehensive guide will take you on a deep dive through the internals of MySQL, providing insights that will help you fine-tune your databases for peak performance and maintain robust, scalable systems.
MySQL Architecture Overview
Connection Handler - The connection handler manages client connections, authentication, and security. It creates a thread for each connection, which can be a bottleneck in high-concurrency environments.
Query Cache - The query cache stores the text of SELECT statements along with the corresponding result sets. If an identical query is received, MySQL can bypass parsing, optimization, and execution (Note: Removed in MySQL 8.0).
Parser - The parser checks SQL syntax and creates a parse tree from the SQL statement.
Optimizer - The optimizer transforms the parse tree into an execution plan. It considers factors like indexes, join orders, and statistical information about the data.
Query Execution Engine - This component executes the plan created by the optimizer, interacting with the storage engines to retrieve or modify data.
Storage Engines - Storage engines are responsible for storing and retrieving data. MySQL's pluggable storage engine architecture allows different storage engines to be used for different tables.
Storage Engines in Depth
InnoDB - is the default and most commonly used storage engine in MySQL. Let's explore its features and internals in detail:
- ACID Compliance - InnoDB provides full ACID (Atomicity, Consistency, Isolation, Durability) compliance, making it suitable for applications requiring high reliability and data integrity.
- Row-Level Locking - InnoDB uses row-level locking for better concurrency. This allows multiple transactions to modify different rows in the same table simultaneously.
- Foreign Key Constraints - InnoDB supports foreign key constraints, helping maintain referential integrity across related tables.
- Buffer Pool - The buffer pool is a memory area where InnoDB caches table and index data. It's crucial for performance optimization. The size of the buffer pool is controlled by the `innodb_buffer_pool_size` parameter.
- Change Buffer - The change buffer optimizes writes to secondary indexes. It stores changes to secondary index pages that are not in the buffer pool, merging them later when the pages are read into memory.
- Adaptive Hash Index - InnoDB can create hash indexes on the fly for faster lookups. This feature is controlled by the `innodb_adaptive_hash_index` parameter.
- Redo Log - The redo log is a disk-based data structure used to achieve durability. It stores a record of all modifications, allowing InnoDB to recover from crashes.
- Doublewrite Buffer - The doublewrite buffer is a storage area where InnoDB writes pages twice to prevent corruption that could occur due to partial page writes.
MyISAM - While less commonly used now, MyISAM is still relevant for certain use cases:
- Table-Level Locking - MyISAM uses table-level locking, which can lead to contention in write-heavy workloads but can be efficient for read-heavy scenarios.
- Full-Text Indexing - MyISAM provides built-in support for full-text indexing, which can be useful for text search applications.
- Delayed Key Write - MyISAM allows delayed key writes, which can improve performance by not immediately flushing index changes to disk.
Memory (HEAP) Engine - The Memory engine creates tables stored in memory:
- Speed - Memory tables are extremely fast as all data is stored in RAM.
- Limitations - Memory tables do not persist after a server restart and have limitations on data types and indexing.
Archive Engine - The Archive engine is designed for storing large amounts of unindexed data in a compressed format:
- Compression - Archive tables are automatically compressed, saving disk space.
- Insert-Only - Archive tables support only INSERT and SELECT operations, making them suitable for log data.
Query Processing and Optimization
Understanding how MySQL processes and optimizes queries is crucial for writing efficient SQL and troubleshooting performance issues.
- Query Execution Flow
- Client sends query: The MySQL client sends an SQL query to the server.
- Connection thread: A thread is assigned to handle the connection.
- Query cache check: (Pre-MySQL 8.0) MySQL checks if the query result is already in the query cache.
- The SQL statement is parsed and a parse tree is created.
- Preprocessing: The parse tree is checked for correctness.
- Optimization: The query optimizer creates an execution plan.
- Cache insertion: (Pre-MySQL 8.0) If caching is enabled, the result is stored in the query cache.
- Result retrieval: The result is sent back to the client.
Query Optimizer
The query optimizer is a critical component in MySQL's performance. It determines the most efficient way to execute a query.
Statistics - The optimizer relies on statistics about tables and indexes. These statistics are stored in the Information Schema and can be updated using the `ANALYZE TABLE` command.
Join Optimization - For queries involving multiple tables, the optimizer determines the best join order and join algorithm (nested loop, hash join, etc.).
Index Selection - The optimizer chooses which indexes to use based on their selectivity and the query conditions.
Subquery Optimization - MySQL can transform certain types of subqueries into more efficient join operations.
EXPLAIN Statement - The EXPLAIN statement is a powerful tool for understanding how MySQL executes a query. Let's look at its output in detail:
EXPLAIN SELECT * FROM users JOIN orders ON users.id = orders.user_id WHERE users.country = 'USA';
This might produce output like:
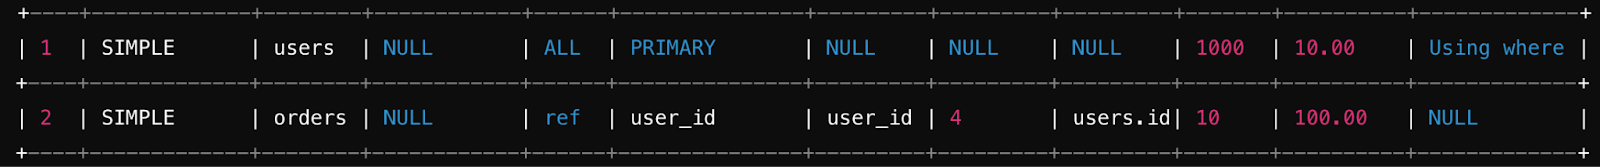
Key fields to focus on:
- type: Shows the join type. 'ALL' indicates a full table scan, which is often undesirable.
- possible_keys and key: Indicate which indexes MySQL considered and actually used.
- rows: Estimates the number of rows MySQL believes it must examine.
- Extra: Provides additional information about how MySQL executes the query.
Query Plan Cache
MySQL 8.0 introduced the query plan cache, which stores the execution plans of prepared statements. This can significantly speed up the execution of repeated prepared statements.
Index Management and Optimization
Indexes are crucial for query performance. Understanding how to create and manage indexes effectively is a key skill for DBAs.
Types of Indexes
- B-Tree Indexes: The most common type of index, B-Tree indexes are used for column comparisons using =, >, ≥, <, ≤, or BETWEEN operators.
- Hash Indexes: Used by the Memory storage engine and InnoDB's adaptive hash index, hash indexes are very fast for equality comparisons but don't support range queries.
- Full-Text Indexes: Supported by InnoDB and MyISAM, full-text indexes are used for full-text searches.
- Spatial Indexes Used for geometry data types, spatial indexes optimize queries on spatial data.
Index Creation Best Practices
Creating and managing indexes effectively is key to query performance:
- Index Columns Used in WHERE Clauses: This allows MySQL to quickly filter rows. For example, in a query like `SELECT * FROM users WHERE email = 'user@example.com';`, an index on the `email` column will significantly speed up the query.
- Index Columns Used in JOIN Conditions: This speeds up table joins. For instance, in `SELECT * FROM orders JOIN customers ON orders.customer_id = customers.id;`, indexing `customer_id` on the `orders` table and `id` on the `customers` table can make the join operation much faster.
- Consider Cardinality: Columns with high cardinality (many unique values) are excellent candidates for indexing, as they help MySQL filter rows more efficiently. For example, a column like `email` that contains mostly unique values is better indexed than a column like `status`, which may only have a few distinct values like 'active' and 'inactive'.
- Use Composite Indexes: For queries that filter or join on multiple columns, a composite index (an index on multiple columns) can be more efficient than several single-column indexes. The order of columns in a composite index matters and should match the query's WHERE clause.
CREATE INDEX idx_user_search ON users (last_name, first_name);
- Monitor Index Usage: Regularly monitor how indexes are used to identify and remove unused or redundant indexes. MySQL's `information_schema` and tools like `pt-index-usage` from Percona Toolkit can help with this task.
SELECT * FROM sys.schema_unused_indexes;
- Be Mindful of Index Size: Indexes consume disk space and can slow down write operations. Balance the need for fast reads with the overhead of maintaining indexes during INSERT, UPDATE, and DELETE operations.
Monitoring Index Usage
Monitoring index usage is crucial for ensuring that indexes are helping rather than hindering performance:
- Using information_schema: The `information_schema` provides detailed information about index usage, including how often each index is used and whether it's effective. Use this data to optimize your indexing strategy.
SELECT * FROM information_schema.INDEX_STATISTICS WHERE table_schema = 'your_database';
- `sys` Schema Views: The `sys` schema in MySQL 8.0+ includes views like `schema_unused_indexes` and `schema_index_statistics` to help identify indexes that are not being used effectively.
- Profiling Indexes: Use query profiling and the `EXPLAIN` command to see which indexes are used by specific queries. This can help you fine-tune queries and indexes for better performance.
Invisible Indexes
- MySQL 8.0 introduced invisible indexes, which are maintained by the optimizer but are not used in query execution. This feature is useful for testing the impact of dropping an index without actually removing it.
- Creating an Invisible Index When creating an index, you can specify it as invisible:
CREATE INDEX idx_email ON users (email) INVISIBLE;
- Making an Index Visible: If you determine that the index should be used after all, you can make it visible again:
ALTER TABLE users ALTER INDEX idx_email VISIBLE;
- Use Cases: Invisible indexes are particularly useful in environments where you want to test the performance impact of removing an index without immediately deleting it.
Transaction Management
Transactions are a fundamental concept in database systems, ensuring data integrity and consistency.
ACID Properties
InnoDB transactions adhere to the ACID properties:
- Atomicity: All operations in a transaction succeed, or the entire transaction is rolled back.
- Consistency A transaction brings the database from one valid state to another, maintaining database invariants.
- Isolation Concurrent transactions are isolated from each other, ensuring that intermediate transaction states are not visible to other transactions.
- Durability Once a transaction is committed, it will remain so, even in the event of a power loss, crash, or error.
Transaction Isolation Levels
MySQL supports four transaction isolation levels, each offering a different balance between performance and data consistency:
- READ UNCOMMITTED The lowest isolation level, where transactions can see uncommitted changes from other transactions. This can lead to dirty reads.
- READ COMMITTED A transaction sees only committed changes made by other transactions. This prevents dirty reads but allows non-repeatable reads.
- REPEATABLE READ MySQL's default isolation level. A transaction sees the same data throughout its lifetime, preventing non-repeatable reads but allowing phantom reads.
- SERIALIZABLE The highest isolation level, where transactions are executed in a way that ensures they could have been run sequentially. This prevents phantom reads but can lead to significant performance overhead.
SET TRANSACTION ISOLATION LEVEL READ COMMITTED;
Deadlock Detection and Resolution
Deadlocks occur when two or more transactions hold locks that the other transactions need to complete their operations, leading to a standstill. InnoDB automatically detects deadlocks and resolves them by rolling back one of the transactions.
- Monitoring Deadlocks Use the `SHOW ENGINE INNODB STATUS` command to monitor deadlocks and understand why they occurred.
- Deadlock Logging Enable deadlock logging to get detailed information about deadlocks:
SET GLOBAL innodb_print_all_deadlocks = ON;
- Avoiding Deadlocks To reduce the likelihood of deadlocks, ensure that transactions acquire locks in a consistent order and keep transactions as short as possible.
Two-Phase Commit
For distributed transactions involving multiple storage engines or servers, MySQL supports the two-phase commit protocol. This protocol ensures that all participants in a transaction either commit or roll back the transaction, maintaining data consistency across distributed systems.
Concurrency Control and Locking
Effective concurrency control is crucial for maintaining data integrity in multi-user environments.
InnoDB Locking
InnoDB provides various locking mechanisms to manage concurrency:
- Row-Level Locks InnoDB primarily uses row-level locks, allowing multiple transactions to modify different rows in the same table simultaneously.
- Record Locks Locks placed on index records, which prevent other transactions from modifying the same records.
- Gap Locks Locks placed on gaps between index records, preventing other transactions from inserting new rows into the gaps.
- Next-Key Locks A combination of record and gap locks that prevents phantom reads by locking the record itself and the gap before the record.
Lock Types
- Shared (S) Locks Allow multiple transactions to read a row simultaneously but prevent other transactions from writing to it.
- Exclusive (X) Locks Prevent any other transaction from reading or writing to the locked row.
- Intention Locks Indicate that a transaction intends to acquire a shared or exclusive lock on a row within a table, allowing the database to lock the entire table if necessary.
Monitoring Locks
Use the `INFORMATION_SCHEMA.INNODB_TRX`, `INNODB_LOCKS`, and `INNODB_LOCK_WAITS` tables (or their Performance Schema equivalents in MySQL 8.0+) to monitor locks:
SELECT * FROM INFORMATION_SCHEMA.INNODB_TRX;
These views provide detailed information about ongoing transactions, locks held by each transaction, and transactions waiting for locks.
Dealing with Lock Contention (continued)
- Optimize Transactions Keep transactions as short as possible to reduce the time locks are held. This minimizes the chance of lock contention.
- Use Appropriate Isolation Levels Lower isolation levels like `READ COMMITTED` can reduce locking overhead and contention, but be aware of the trade-offs in terms of consistency.
- Avoid Hot Spots Design your schema and queries to minimize contention on frequently accessed rows or tables. For example, consider spreading writes across multiple rows or tables rather than concentrating them in one place.
- Consider Optimistic Locking In scenarios with low contention, optimistic locking can be more efficient than pessimistic locking. This approach involves checking if the data has been modified by another transaction before committing changes.
- Partitioning If a table is frequently accessed by multiple transactions, consider partitioning the table to reduce contention on specific rows.
Memory Management
Efficient memory management is crucial for MySQL performance. Inadequate memory allocation can lead to excessive disk I/O, which can significantly degrade performance.
InnoDB Buffer Pool
The buffer pool is InnoDB's most important memory area. It caches table and index data, significantly reducing disk I/O by allowing queries to retrieve data directly from memory.
Buffer Pool Size The buffer pool size is controlled by the `innodb_buffer_pool_size` parameter. It should typically be set to 70-80% of the available memory on a dedicated MySQL server.
SET GLOBAL innodb_buffer_pool_size = 8G;
- Multiple Buffer Pool Instances For better concurrency in high-traffic environments, you can split the buffer pool into multiple instances using the `innodb_buffer_pool_instances` parameter.
SET GLOBAL innodb_buffer_pool_instances = 8;
- Monitoring Buffer Pool Usage Use the `SHOW ENGINE INNODB STATUS` command to monitor buffer pool activity, including hit rates, free memory, and dirty pages.
SHOW ENGINE INNODB STATUS\G
Query Cache (Pre-MySQL 8.0)
The query cache was removed in MySQL 8.0, but understanding it is important for managing older MySQL versions:
- Query Cache Size Set the query cache size using the `query_cache_size` parameter. A larger cache size can improve performance for read-heavy workloads, but it may also lead to contention on cache locks.
SET GLOBAL query_cache_size = 16M;
- Enable/Disable Query Cache The query cache can be enabled or disabled using the `query_cache_type` parameter.
SET GLOBAL query_cache_type = ON;
Table Cache
The table cache stores table metadata to reduce the overhead of opening and closing tables. A larger table cache can improve performance, especially in environments with many frequently accessed tables.
- Table Cache Size Set the table cache size using the `table_open_cache` parameter.
SET GLOBAL table_open_cache = 4000;
Monitoring Table Cache Usage Use the `SHOW STATUS LIKE 'Open_tables';` command to monitor how many tables are open and adjust the cache size accordingly.
SHOW STATUS LIKE 'Open_tables';
Thread Cache
- The thread cache stores unused connection threads, allowing MySQL to reuse them without the overhead of creating new threads. This is particularly beneficial in high-traffic environments.
- Thread Cache Size Set the thread cache size using the `thread_cache_size` parameter.
SET GLOBAL thread_cache_size = 100;
- Monitoring Thread Cache Usage Use the `SHOW STATUS LIKE 'Threads_created';` command to monitor how often new threads are created and adjust the cache size to reduce this number.
SHOW STATUS LIKE 'Threads_created';
Logging and Recovery
Proper logging is essential for troubleshooting and recovery. MySQL provides several logging options, each serving a different purpose.
Binary Log
The binary log records all changes to the database and is used for replication and point-in-time recovery.
- Enable Binary Logging Enable binary logging by setting the `log_bin` parameter.
SET GLOBAL log_bin = 'mysql-bin';
- Log Format MySQL supports three binary log formats: Statement-based, Row-based, and Mixed. The choice of format depends on the specific use case, with Row-based logging often preferred for its accuracy in capturing changes.
SET GLOBAL binlog_format = 'ROW';
- Managing Binary Logs Regularly monitor and rotate binary logs to prevent them from consuming excessive disk space. Use the `PURGE BINARY LOGS` command to delete old logs.
PURGE BINARY LOGS BEFORE '2024-01-01 00:00:00';
Slow Query Log
The slow query log helps identify queries that take longer than expected to execute, which can be optimized to improve performance.
- Enable Slow Query Logging Enable the slow query log with the `slow_query_log` parameter.
SET GLOBAL slow_query_log = 'ON';
- Set Threshold for Slow Queries Define what constitutes a slow query by setting the `long_query_time` parameter.
SET GLOBAL long_query_time = 2; -- 2 seconds
- Analyzing Slow Queries Use tools like `mysqldumpslow` or `pt-query-digest` from Percona Toolkit to analyze slow queries and identify optimization opportunities bash:
mysqldumpslow -t 10 /var/log/mysql/slow-query.log
General Query Log
The general query log records all client connections and queries. While useful for debugging, it can generate a large volume of data and should be used sparingly.
- Enable General Query Logging Enable the general query log with the `general_log` parameter.
SET GLOBAL general_log = 'ON';
- Log File Location Specify the location of the general query log file using the `general_log_file` parameter.
SET GLOBAL general_log_file = '/var/log/mysql/general.log';
Error Log
The error log records startup, shutdown, and error information. It is critical for diagnosing issues with MySQL.
- Error Log Location Specify the location of the error log using the `log_error` parameter.
SET GLOBAL log_error = '/var/log/mysql/error.log';
- Monitoring the Error Log Regularly monitor the error log for warnings, errors, and other significant events that may require attention.
InnoDB Redo Log
The InnoDB redo log is crucial for crash recovery, as it ensures that committed transactions are not lost even if MySQL crashes.
- Redo Log Size Set the size of the redo log using the `innodb_log_file_size` parameter. A larger redo log reduces the frequency of log flushing but requires more disk space.
SET GLOBAL innodb_log_file_size = 512M;
- Monitoring Redo Log Activity Use the `SHOW ENGINE INNODB STATUS` command to monitor redo log activity and ensure that log file size and flushing frequency are properly tuned.
Replication
Replication is a key feature for scalability and high availability, allowing data to be replicated from one MySQL server (the primary) to one or more replicas.
Replication Types
- Asynchronous Replication The default replication type, where the primary server writes events to its binary log and replicas request these events asynchronously. This type of replication is fast but can lead to data inconsistencies if the primary server fails before the events are replicated.
- Semi-Synchronous Replication The primary server waits for at least one replica to acknowledge receipt of events before committing transactions. This provides better data consistency but at the cost of higher latency.
- Group Replication A system of servers that use consensus to ensure data consistency across the group. Group Replication provides a fully-synchronous replication mechanism with automatic failover.
Binary Log Formats
- Statement-Based Replication (SBR) Replicates entire SQL statements. It is simple but can cause issues with non-deterministic queries.
- Row-Based Replication (RBR) Replicates only the changed rows. It is more precise and avoids many of the issues associated with SBR, but it generates larger binary logs.
- Mixed Uses SBR when possible, falling back to RBR when necessary.
SET GLOBAL binlog_format = 'ROW';
Setting Up Replication
Setting up replication involves configuring the primary and replica servers:
- Enable Binary Logging on the Primary
SET GLOBAL log_bin = ON;
- Create a Replication User
CREATE USER 'repl'@'%' IDENTIFIED BY 'password';
GRANT REPLICATION SLAVE ON *.* TO 'repl'@'%';
- Get the Binary Log Coordinates
SHOW MASTER STATUS;
- Configure the Replica
CHANGE MASTER TO
MASTER_HOST='primary_host',
MASTER_USER='repl',
MASTER_PASSWORD='password',
MASTER_LOG_FILE='mysql-bin.000003',
MASTER_LOG_POS=73;
Setting Up Replication (continued)
- Start Replication
START SLAVE;
- Once replication is started, the replica will begin reading from the primary's binary log and replicating the changes.
Monitoring Replication
- To ensure replication is functioning correctly, regularly monitor the replication status:
- Check Replica Status Use the `SHOW SLAVE STATUS\G` command to check the replication status on a replica. This command provides detailed information about the state of the replication process.
SHOW SLAVE STATUS\G
Key fields to monitor:
- `Slave_IO_Running` and `Slave_SQL_Running` should both be "Yes", indicating that replication is proceeding normally.
- `Seconds_Behind_Master` indicates how much time the replica is lagging behind the primary. A large value here could indicate performance issues or network problems.
- Replication Lag Monitor replication lag carefully. Significant lag can lead to stale data on the replica, which can be problematic for applications that rely on up-to-date information.
Replication Topologies
MySQL supports various replication topologies, each suited to different use cases:
- Primary-Replica The most common setup, where one primary server replicates to one or more replicas. This setup is ideal for read scaling and backups.
- Primary-Primary Also known as multi-master replication, where two servers act as both primary and replica to each other. This setup can be complex to manage due to potential conflicts but offers high availability.
- Ring A ring topology is where each server is a primary to its neighbor and a replica to another. While it offers redundancy, it can be difficult to manage and is prone to problems if any server in the ring fails.
- Star A central primary server replicates to multiple replicas. This topology is simple to manage and is commonly used for read scaling.
- Cascading Replication A hierarchy where one replica acts as the primary for other replicas. This setup is useful for distributing replication load across multiple servers.
Partitioning
Partitioning allows you to distribute large tables across multiple storage devices, improving performance and manageability for very large databases.
Partitioning Types
MySQL supports several types of partitioning, each with its use cases:
- Range Partitioning Rows are stored in partitions based on column values falling within a given range. This is useful for time-series data, where you can easily archive or drop old data by removing partitions.
CREATE TABLE sales (
id INT,
amount DECIMAL(10,2),
sale_date DATE
)
PARTITION BY RANGE (YEAR(sale_date)) (
PARTITION p0 VALUES LESS THAN (2020),
PARTITION p1 VALUES LESS THAN (2021),
PARTITION p2 VALUES LESS THAN (2022),
PARTITION p3 VALUES LESS THAN MAXVALUE
);
- List Partitioning Rows are stored in partitions based on column values matching one of a set of discrete values. This is ideal for data that naturally divides into a set of distinct categories.
CREATE TABLE employees (
id INT,
name VARCHAR(50),
department VARCHAR(20)
)
PARTITION BY LIST (department) (
PARTITION p_tech VALUES IN ('IT', 'Engineering'),
PARTITION p_sales VALUES IN ('Sales', 'Marketing'),
PARTITION p_admin VALUES IN ('HR', 'Finance')
);
- Hash Partitioning Rows are distributed across partitions based on a hash of the partitioning column's value. This ensures an even distribution of data across partitions and is useful when the distribution of data is not naturally even.
CREATE TABLE orders (
id INT,
customer_id INT,
order_date DATE
)
PARTITION BY HASH (customer_id)
PARTITIONS 4;
- Key Partitioning Similar to hash partitioning, but the hashing function is supplied by MySQL. This can be useful when you want MySQL to determine the best way to distribute data across partitions.
CREATE TABLE sessions (
id INT,
user_id INT,
session_data BLOB
)
PARTITION BY KEY (id)
PARTITIONS 4;
Partition Management
Managing partitions is an ongoing task that includes adding, dropping, and reorganizing partitions as data grows and changes:
- Adding Partitions Add new partitions as needed to accommodate new data.
ALTER TABLE sales ADD PARTITION (PARTITION p4 VALUES LESS THAN (2023));
- Dropping Partitions Drop partitions when data is no longer needed to free up space and improve performance.
ALTER TABLE sales DROP PARTITION p0;
- Reorganizing Partitions Reorganize partitions to merge or split them as data patterns change.
ALTER TABLE sales REORGANIZE PARTITION p1, p2 INTO (
PARTITION p12 VALUES LESS THAN (2022)
);
Partition Pruning
Partition pruning is an optimization where MySQL’s query executor skips scanning partitions that are known not to contain any matching values. This can significantly improve query performance on partitioned tables, especially with large datasets.
- Effective Partition Pruning For partition pruning to be effective, queries must include the partitioning column in the WHERE clause. MySQL will then automatically exclude partitions that do not need to be scanned.
SELECT * FROM sales WHERE sale_date >= '2021-01-01';
Limitations of Partitioning
While partitioning can offer significant benefits, it also comes with some limitations:
- Primary Keys and Unique Keys Primary keys and unique keys must include all partitioning columns. This can complicate schema design if your primary or unique constraints are not aligned with your partitioning strategy.
- Foreign Keys MySQL does not support foreign keys in partitioned tables. If your schema relies heavily on foreign key constraints, this limitation can be a significant drawback.
- Full-Text Indexes Full-text indexes are not supported on partitioned tables. If your application relies on full-text searches, you may need to rethink your partitioning strategy.
Performance Monitoring and Tuning
Continuous monitoring and tuning are essential for maintaining optimal MySQL performance. Identifying and addressing performance bottlenecks quickly can make the difference between a smoothly running application and one that struggles under load.
Key Performance Metrics
Monitoring key performance metrics provides insight into how well your MySQL server is performing:
- Query Response Time Track how long it takes for queries to execute. Long response times indicate that queries need to be optimized or that the server is under heavy load. Use the Performance Schema or tools like MySQL Enterprise Monitor to monitor query response times.
- Throughput Monitor the number of queries per second, transactions per second, and bytes sent/received to gauge the load on your MySQL server. High throughput with low response times is an indicator of good performance.
- Connections Monitor the number of current connections and connection errors. If the number of connections is consistently high, consider increasing the `max_connections` setting.
SHOW STATUS LIKE 'Threads_connected';
SHOW STATUS LIKE 'Connection_errors%';
- Buffer Pool Utilization Monitor how much of the InnoDB buffer pool is being used. High utilization with low disk I/O indicates that the buffer pool is well-sized. If disk I/O is high, consider increasing the buffer pool size.
SHOW ENGINE INNODB STATUS;
Performance Schema
The Performance Schema provides detailed performance metrics about MySQL's internal operations, such as I/O waits, query execution times, and memory usage.
- Configuring the Performance Schema By default, the Performance Schema is enabled, but it can be configured to monitor specific events or resources to minimize overhead.
UPDATE performance_schema.setup_instruments SET ENABLED = 'YES' WHERE NAME = 'wait/io/file/%';
- Query Analysis Use the Performance Schema to analyze queries that consume the most resources and identify opportunities for optimization.
SELECT * FROM performance_schema.events_statements_summary_by_digest
ORDER BY sum_timer_wait DESC LIMIT 10;
Slow Query Log Analysis
The slow query log is a valuable tool for identifying queries that take longer than expected to execute. Analyzing the slow query log can help you identify and optimize problematic queries.
- Analyzing Slow Queries Use `mysqldumpslow` or `pt-query-digest` to summarize and analyze the slow query log, identifying which queries to focus on for optimization. Bash:
mysqldumpslow -t 10 /var/log/mysql/slow-query.log
Query Optimization Techniques
Optimizing queries is a critical part of database management. Even small improvements in query performance can lead to significant gains in overall system performance:
- Use EXPLAIN Analyze query execution plans with `EXPLAIN` to understand how MySQL executes queries and where improvements can be made.
EXPLAIN SELECT * FROM orders WHERE order_date >= '2024-01-01';
- Optimize Indexes Ensure that the right indexes are in place to support your queries. Regularly review and update indexes based on query patterns.
- Avoid SELECT * Only select the columns you need. Selecting all columns (`SELECT *`) can lead to unnecessary I/O and memory usage, especially with large tables.
- Use LIMIT When working with large result sets, use the `LIMIT` clause to restrict the number of rows returned by a query. This reduces the amount of data processed and sent to the client, improving performance.
SELECT * FROM orders WHERE order_date >= '2024-01-01' LIMIT 100;
- Optimize JOINs Ensure that JOIN operations are optimized by using indexes on columns involved in the JOIN condition. Avoid joining too many tables in a single query, as this can lead to complex execution plans and slow performance.
- Avoid Subqueries Where possible, replace subqueries with JOINs or use `EXISTS` instead of `IN` for subquery conditions, as these can often be more efficient.
-- Subquery example
SELECT * FROM orders WHERE customer_id IN (SELECT id FROM customers WHERE status = 'active');
-- Optimized with JOIN
SELECT orders.* FROM orders
JOIN customers ON orders.customer_id = customers.id
WHERE customers.status = 'active';
- Use UNION ALL Instead of UNION If you know that the result sets being combined do not contain duplicates, use `UNION ALL` instead of `UNION`, as `UNION ALL` is faster because it does not perform a duplicate elimination.
SELECT name FROM customers_a
UNION ALL
SELECT name FROM customers_b;
Configuration Tuning
MySQL’s configuration parameters have a significant impact on performance. Tuning these parameters based on the workload and hardware resources available can greatly enhance performance.
- innodb_buffer_pool_size As mentioned earlier, this parameter should typically be set to 70-80% of the available memory on a dedicated MySQL server.
- innodb_log_file_size Set this parameter to an appropriate size based on the workload. A larger log file size reduces the frequency of checkpoints, which can improve performance, especially for write-intensive workloads.
SET GLOBAL innodb_log_file_size = 1G;
- max_connections Set this parameter based on the expected number of concurrent connections. Ensure that the server has sufficient resources to handle the maximum number of connections.
SET GLOBAL max_connections = 500;
- table_open_cache Set this parameter based on the number of tables frequently accessed by queries. A larger table cache improves performance by reducing the need to reopen tables.
SET GLOBAL table_open_cache = 4000;
Hardware Considerations
The underlying hardware plays a crucial role in MySQL performance. Optimizing hardware resources can lead to substantial performance improvements:
- Use SSDs Solid State Drives (SSDs) offer significantly faster read and write speeds compared to traditional hard drives, reducing I/O wait times and improving overall query performance.
- Ensure Sufficient RAM Adequate memory is essential for caching data in the InnoDB buffer pool and for running large queries without excessive disk I/O. Ensure your server has enough RAM to support the workload.
- Consider RAID Configurations For improved reliability and performance, consider using RAID configurations. RAID 10, for example, provides a good balance of performance and redundancy.
- CPU Considerations Ensure the CPU has enough cores to handle the expected workload. Multi-threaded workloads benefit from CPUs with higher core counts.